What Is Standard Deviation – Definition, Formula and Examples
What Is Standard Deviation?
Standard deviation quantifies the degree of dispersion or spread in a set of numerical values relative to their mean. As the square root of variance, it returns variability measurements to the original units of the data, enabling intuitive interpretation of how tightly observations cluster around the average.
Mathematically, this statistic serves as the cornerstone of descriptive statistics. It distinguishes between datasets that exhibit consistent, predictable patterns and those characterized by extreme volatility or heterogeneity.
Professionals across finance, meteorology, manufacturing, and social sciences rely on this measure to assess risk, quality control, and population characteristics. Its universal applicability stems from the mathematical properties that link it to the normal distribution and probability theory.
What Is Standard Deviation?
Definition
Measure of data dispersion around the arithmetic mean
Formula
Square root of variance (σ for populations, s for samples)
Primary Use
Risk assessment, quality control, and variability comparison
Units
Identical to original measurement scale (e.g., dollars, kilograms)
Key Characteristics:
- Low values indicate data points cluster tightly around the mean, suggesting consistency.
- High values reveal substantial spread, indicating volatility or diverse outcomes.
- Population parameters use the Greek letter σ, while sample statistics use Latin s.
- Calculation requires computing the mean, then measuring squared deviations from that center.
- Unlike variance, it preserves the original measurement units, facilitating direct comparisons.
- It serves as the foundation for the empirical rule in normally distributed populations.
- The metric demonstrates sensitivity to outliers due to the squaring of differences.
| Statistical Term | Symbol | Formula | Application Context |
|---|---|---|---|
| Population Standard Deviation | σ | √[Σ(xi − μ)²/N] | Complete dataset analysis (census) |
| Sample Standard Deviation | s | √[Σ(xi − x̄)²/(n−1)] | Inferential statistics (estimation) |
| Population Variance | σ² | Σ(xi − μ)²/N | Theoretical probability distributions |
| Sample Variance | s² | Σ(xi − x̄)²/(n−1) | Unbiased population estimation |
| Arithmetic Mean | μ or x̄ | Σxi/n | Central tendency reference point |
| Bessel’s Correction | n−1 | (Denominator adjustment) | Corrects sample underestimation bias |
How Do You Calculate Standard Deviation?
The computation involves a systematic five-step process that transforms raw data into a standardized variability measure. According to mathematical definitions, this procedure applies universally across disciplines, though the denominator choice depends on whether the data represents a complete population or a subset.
The Fundamental Formula
For populations encompassing every member of a defined group, the formula divides the sum of squared deviations by the total count N. For samples drawn from larger populations, mathematical conventions require dividing by n−1 to produce an unbiased estimator.
Population Versus Sample Distinctions
When analyzing complete populations—such as the heights of all students in a specific classroom—statisticians employ the population formula using N in the denominator. This calculation yields the parameter σ, representing the true dispersion of that specific group.
Conversely, when inferring characteristics of a larger population from a subset, statistical practice mandates using n−1. This adjustment, known as Bessel’s correction, compensates for the tendency of samples to underestimate population variability by accounting for the degrees of freedom lost when estimating the mean from the same data.
When working with sample data, dividing by n−1 rather than n compensates for the tendency of samples to underestimate population variability. This adjustment yields an unbiased estimator of the population standard deviation, correcting for the loss of one degree of freedom when calculating the sample mean.
Step-by-Step Manual Calculation
Educational demonstrations outline the mechanical process:
- Calculate the arithmetic mean by summing all values and dividing by the count.
- Subtract the mean from each individual data point to determine deviations.
- Square each deviation to eliminate negative values and emphasize outliers.
- Sum the squared deviations to obtain the total squared error.
- Divide by N (population) or n−1 (sample) to calculate variance, then take the square root.
Automated Calculation in Excel
Microsoft Excel provides built-in functions that automate these computations. For population data, the formula =STDEV.P(range) or =SQRT(VAR.P(range)) returns σ. For sample data, =STDEV.S(range) or =SQRT(VAR.S(range)) calculates s. Digital calculators offer similar functionality for immediate statistical analysis.
How to Interpret Standard Deviation?
Magnitude alone does not determine whether a standard deviation is “good” or “bad”; context drives interpretation. In manufacturing, a low value indicates precise production tolerances, while in investment markets, the same value might suggest insufficient volatility for certain trading strategies.
Reading High and Low Values
Analysis reveals that low standard deviations indicate data points cluster tightly around the mean, suggesting homogeneity and predictability. High values signal wide dispersion, indicating heterogeneity, volatility, or the presence of diverse subgroups within the dataset.
The Normal Distribution Connection
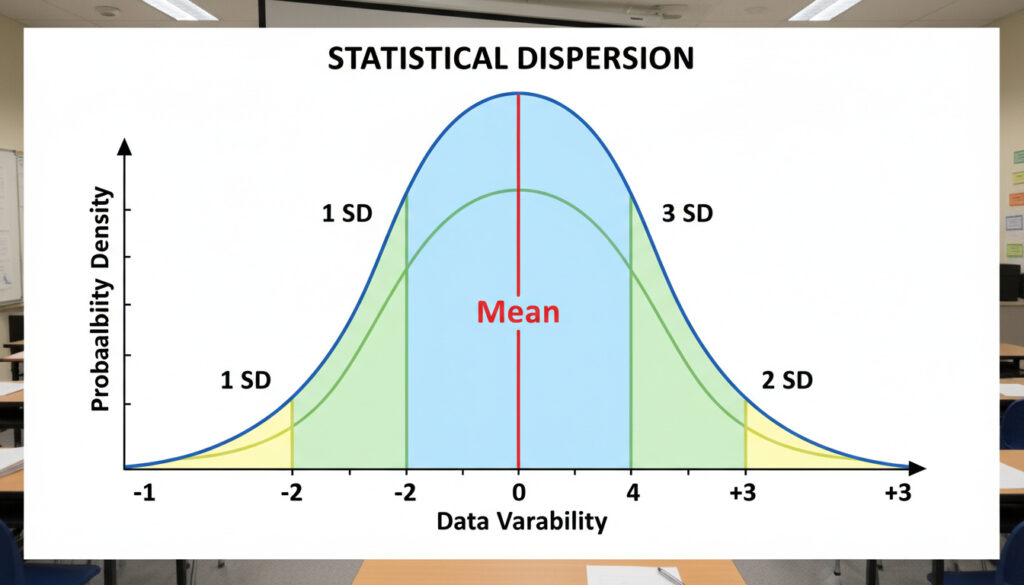
In normally distributed data following the bell curve pattern, standard deviation determines the curve’s width and the probability of observations falling within specific ranges. Empirical evidence demonstrates that approximately 68% of values fall within one standard deviation of the mean, 95% within two deviations, and 99.7% within three deviations.
In normally distributed data, approximately 68% of values fall within one standard deviation of the mean, 95% within two deviations, and 99.7% within three deviations. This predictable pattern enables rapid probabilistic assessments without complex calculations.
Standard Deviation vs. Variance
Variance represents the average of squared deviations from the mean, providing the mathematical foundation for standard deviation. However, variance expresses dispersion in squared units—such as squared dollars or squared meters—which complicates direct interpretation relative to the original data.
Standard deviation emerges as the square root of variance, restoring the original measurement units and enabling immediate comparison with the mean. Mathematical references confirm this relationship while noting that both measures remain sensitive to extreme values due to the squaring operation.
Variance expresses dispersion in squared units (e.g., squared dollars, squared centimeters), making interpretation counterintuitive. Standard deviation restores the original measurement units by taking the square root, facilitating direct comparison with the mean and individual data points.
Standard Deviation Examples
Concrete calculations illuminate the abstract formulas. Educational datasets demonstrate how the choice between population and sample formulas alters results. To better understand these concepts, you can explore Lars real girl mental disorder meaning.
Population Calculation Example
Consider the dataset: 9, 2, 5, 4, 12, 7, 8, 11. The mean equals 6.56. Squared differences from this mean sum to approximately 71.11. Dividing by N=9 yields a variance of 7.90, producing a population standard deviation of approximately 2.81.
Sample Calculation Example
For the sample data 1, 3, 4, 7, 8 with mean 4.6, squared deviations sum to 33.2. Applying Bessel’s correction by dividing by 4 (n−1) rather than 5 yields a variance of 8.3, resulting in a sample standard deviation of approximately 2.88.
Biometric Application
Medical statistics provide a practical illustration using height measurements with a mean of 75 inches. With a sum of squared deviations totaling 784, the variance equals 87.1 (784 divided by 9), yielding a standard deviation of 9.3 inches. This indicates that typical heights fall within 9.3 inches above or below the average.
Historical Development of Statistical Dispersion
The conceptual framework for measuring dispersion emerged from astronomical observations and error analysis in the early nineteenth century.
- : Adrien-Marie Legendre introduces the method of least squares for fitting data, laying groundwork for squared deviation calculations.
- : Carl Friedrich Gauss formalizes the standard deviation concept while developing theories of observational error and normal distributions.
- : Karl Pearson advances biometric applications, popularizing statistical methods in biological and social sciences.
- : Ronald Fisher clarifies the distinction between population parameters and sample statistics, formalizing degrees of freedom corrections.
- : Integration into early computational machines enables widespread adoption across scientific disciplines.
- : Ubiquitous implementation in statistical software packages, spreadsheet applications, and programming languages.
Established Certainties and Methodological Limitations
While the mathematical definition of standard deviation remains unambiguous, practical application involves distinct domains of certainty and uncertainty.
Established Facts
- Precise mathematical definition and calculation algorithms
- Proven relationship to variance via square root transformation
- Verified behavior in normal distributions (68-95-99.7 rule)
- Documented sensitivity to outliers and extreme values
- Standardized computational methods across software platforms
Uncertainties and Constraints
- No universal threshold defines “acceptable” variability without domain context
- Assumption of normality often violated in real-world skewed distributions
- Optimal sample sizes for stable estimates remain context-dependent
- Robust alternatives (MAD, IQR) may better represent dispersion for heavy-tailed data
- Standard error distinctions sometimes confuse interpretation
Practical Significance Across Disciplines
Financial analysts employ standard deviation to quantify volatility in equity markets. The All Ordinaries Index – What It Is, History and How to Invest demonstrates how dispersion measures help investors assess risk relative to expected returns. High volatility indicates potential for significant price swings, while low volatility suggests stable valuation patterns.
In psychological assessment and personality research, clinicians use standard deviation to interpret test scores and diagnostic criteria. Understanding variability in behavioral traits, such as those examined in What Is A Narcissist – Signs, Causes And Coping Strategies, relies on statistical norms derived from population samples. Deviations from established means inform diagnostic thresholds and treatment planning.
Quality control engineers monitor manufacturing processes using control charts based on standard deviation. Weather forecasters incorporate historical temperature and precipitation variability to communicate uncertainty ranges. Educational researchers analyze test score dispersion to evaluate curriculum effectiveness and equity across student populations.
Academic Foundations and Source Authority
The mathematical rigor underlying standard deviation calculations derives from established statistical literature and governmental educational resources.
Standard deviation measures the dispersion or spread of data values from their mean in a dataset, calculated as the square root of the variance.
— Wikipedia, Standard Deviation
The population standard deviation is calculated by taking the square root of the average of squared deviations from the population mean.
— National Library of Medicine, Introduction to Statistics
Key Takeaways
Standard deviation provides the fundamental language for describing data variability, transforming abstract dispersion into measurable quantities expressed in original units. Whether assessing financial risk through indices like the All Ordinaries Index – What It Is, History and How to Invest, evaluating manufacturing precision, or interpreting psychological assessments, this statistic bridges raw numbers and actionable insight. Mastery of its calculation—distinguishing between population parameters and sample estimates—enables rigorous analysis across scientific and commercial domains.
Frequently Asked Questions
What distinguishes standard deviation from standard error?
Standard deviation measures variability within a single dataset, while standard error quantifies the precision of the sample mean as an estimate of the population mean. Standard error equals the standard deviation divided by the square root of the sample size, decreasing as samples grow larger.
Can standard deviation values be negative?
No. Standard deviation represents the square root of variance, and since squared deviations are always non-negative, the result must be zero or positive. A value of zero indicates all data points are identical.
What does a standard deviation of zero indicate?
A zero value indicates no variability—all observations in the dataset are identical to the mean. This perfect homogeneity rarely occurs in empirical data but might appear in standardized testing or controlled experimental conditions.
How does sample size affect standard deviation reliability?
Larger samples generally produce more stable estimates of population standard deviation, reducing the impact of random outliers. However, the standard deviation formula automatically accounts for sample size through Bessel’s correction (n−1) in the denominator.
Why calculate standard deviation rather than using mean absolute deviation?
Standard deviation’s squared differences provide mathematical properties that enable variance addition and underpin the normal distribution’s theoretical framework. While mean absolute deviation is more robust to outliers, standard deviation facilitates advanced statistical inference and probability calculations.
More related posts
 Mick Jagger at 82: Health, Family, and the Queen’s Knighthood Refusal
 Zali Burrows: Biography, Age, Net Worth, Lehrmann Lawyer
 Bradley James 2025: Current Life, Career & Updates
 Bo Burnham: Anxiety, Relationship, and Career Achievements
 Instant Hot Water System: Pros, Cons & Ireland Guide
 Nasdaq 100 Futures: Price, Trading Hours & Index Comparison
 Athena Strand Murder: FedEx Driver Gets Death Sentence
 James Gandolfini Death: Cause, Brad Pitt Tribute & Dark Side