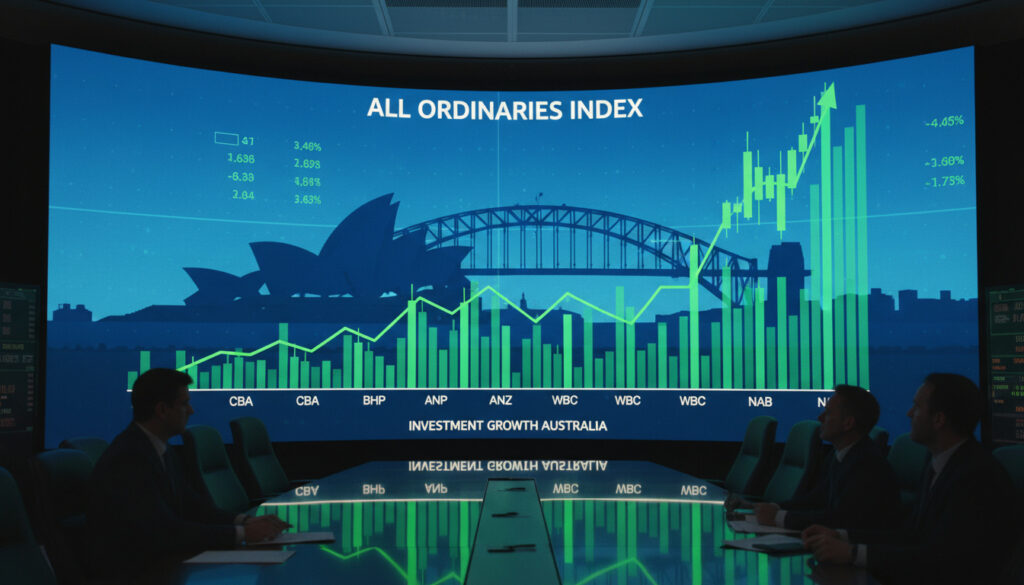
All Ordinaries Index – What It Is, History and How to Invest
The All Ordinaries Index stands as Australia’s most comprehensive equity benchmark, tracking the nation’s 500 largest publicly traded companies since 1980. Established to replace fragmented regional indices, this flagship indicator captures over 95 percent of the Australian Securities Exchange’s total market capitalisation, offering the broadest available measure of domestic equity performance.
Market participants commonly reference the index as the “All Ords,” watching its movements to gauge broader economic sentiment across sectors ranging from mining to financial services. S&P Dow Jones Indices manages the benchmark in partnership with the ASX, maintaining strict market-capitalization-weighted methodologies that reflect free-float rather than total outstanding shares.
What is the All Ordinaries Index?
Launched in January 1980 with a base value of precisely 500 points, the All Ordinaries Index pioneered national market tracking in Australia. According to historical exchange records, the index originally covered approximately 87 percent of the equities market before expanding its reach. Today, it encompasses the 500 largest companies listed on the ASX, ranked strictly by aggregate market value.
- Australia’s oldest continuously running stock market index
- Base value established at 500 points in 1980
- Free-float market capitalization weighted calculation
- Ticker symbols: XAO (price) and XAOA (total return)
- Replaced smaller state-based and regional indices
- Restructured April 2000 to fixed 500-company membership
| Attribute | Specification |
|---|---|
| Full Name | S&P/ASX All Ordinaries Index |
| Common Abbreviation | All Ords |
| Base Date | January 1980 |
| Base Value | 500 points |
| Constituent Universe | 500 largest ASX-listed entities |
| Selection Method | Market capitalization ranking |
| Weighting Method | Free-float market cap weighted |
| Initial Market Coverage | ~87% of equities market (1980) |
| Current Market Coverage | ~95% of ASX market value |
| Price Index Ticker | XAO |
| Total Return Ticker | XAOA |
What is the Current All Ordinaries Index Value?
The index achieved a record closing value of 8,825.10 on 14 February 2025, with an intra-day peak reaching 8,882.70 during that session. Wikipedia’s financial data archives confirm this represents the most recent verified benchmark available in public records as of early 2025.
Market volatility remains inherent. While historical data confirms specific closing figures, real-time valuations fluctuate continuously during trading hours. Real-time data requires direct consultation with ASX or S&P Dow Jones Indices platforms using ticker symbol XAO.
Tracking Real-Time Market Movements
Investors seeking immediate price data rely on official Australian Securities Exchange feeds or authorized S&P Dow Jones Indices resources. These platforms provide authoritative live charting and historical data downloads. Third-party financial websites may display delayed prices, creating potential gaps between displayed and actual market values.
Historical Context of Recent Highs
The February 2025 peak capped a prolonged recovery trajectory spanning over a decade. When the index reaches 5,000 points, it nominally represents a tenfold increase from its 1980 base of 500, though this does not account for inflation adjustments or dividend reinvestment effects captured in the XAOA variant.
On 14 February 2025, the All Ordinaries Index closed at 8,825.10, establishing a definitive record high and demonstrating substantial long-term growth from its 500-point origin.
Historical Performance of the All Ordinaries Index
Four decades of market data reveal dramatic swings reflecting global economic cycles. The index climbed to 6,873.20 on 31 October 2007 before the subprime crisis triggered a 24 percent collapse to 5,222.0 by 22 January 2008. This volatility illustrates the index’s sensitivity to international financial contagion.
Further turbulence arrived on 5 August 2011, when the benchmark dipped to 4,159 points during broader market uncertainty. Recovery proved gradual, with the index reclaiming the 5,000 threshold only in February 2013.
The 2000 Restructuring
On 3 April 2000, administrators fundamentally restructured the index to fix membership at exactly the 500 largest companies by market capitalization, eliminating prior liquidity requirements. This change allowed inclusion of firms with market caps as low as $20 million provided they ranked within the top 500, coinciding with the ASX 200 launch that diminished the All Ordinaries’ prominence for derivative products.
Crisis Patterns and Resilience
Each major downturn eventually reversed into expansion. The 2007-2008 financial crisis wiped out significant value, yet the index ultimately surpassed previous peaks. Similar resilience followed the 2011 lows, demonstrating the underlying growth trajectory of Australian large-cap equities despite periodic shocks.
How to Invest and Compare the All Ordinaries Index
Direct replication of all 500 All Ordinaries constituents presents practical challenges for individual investors due to transaction costs and rebalancing frequency. Most market participants gain exposure through Exchange Traded Funds (ETFs) or similar pooled vehicles tracking the index or related broad-market benchmarks.
Investment Vehicles and Strategies
The All Ordinaries Total Return Index (XAOA) offers a distinct advantage over the standard price-only XAO by reinvesting dividends, providing a more accurate reflection of total shareholder returns. Westpac’s trading education resources note that direct index products remain limited compared to ASX 200 offerings, requiring investors to use ASX platforms or brokerage services for access.
Direct investment tracking all 500 constituents proves impractical for most retail portfolios due to transaction costs and rebalancing frequency. ETFs offer scalable alternatives with professional management handling constituent changes.
Understanding the ASX 200 Difference
The All Ordinaries encompasses the ASX 200 plus the next 300 largest companies by market cap. While the All Ords offers broader representation, the ASX 200 has become the preferred benchmark for exchange-traded products due to its liquidity concentration and derivative suitability. The ASX 200 has become the preferred benchmark for exchange-traded products due to its liquidity concentration and derivative suitability, and you can learn more about the All Ordinaries Index at What is a latency test.
Standard XAO tracks price only. For total return calculations including reinvested dividends, reference the All Ordinaries Total Return Index (XAOA) managed by the same partnership.
| Aspect | All Ordinaries (XAO) | S&P/ASX 200 |
|---|---|---|
| Constituents | 500 largest by market cap (~95% of ASX value) | Top 200 by market cap (liquidity focus) |
| Coverage | Broader, includes smaller caps (as low as ~$20M) | Narrower; top 100 comprise ~86% of All Ords weight |
| Primary Usage | General market benchmark | Preferred for ETPs and derivatives |
| Relationship | Encompasses ASX 200 plus next 300 | Subset of All Ordinaries |
Key Milestones in All Ordinaries History
- : Index launches with base value of 500 points, replacing regional indices
- : Restructured to fixed 500-company format; ASX 200 simultaneously introduced
- : Pre-GFC peak reaches 6,873.20
- : Subprime crisis triggers fall to 5,222.0 (24% decline)
- : Index hits low of 4,159 amid European debt concerns
- : Recovery pushes index back above 5,000
- : Record close of 8,825.10 established
Data Certainty and Market Uncertainties
| Established Information | Information Requiring Verification |
|---|---|
| Record close of 8,825.10 on 14 February 2025 | Real-time values beyond February 2025 (consult live feeds) |
| Base value of 500 in January 1980 | Future index movements and closing prices |
| 500 constituent companies by market cap ranking | Exact dates of upcoming reconstitutions |
| S&P Dow Jones Indices management partnership with ASX | Short-term volatility predictions |
| ~95% coverage of ASX market value | Precise daily constituent weightings without real-time feeds |
The Role of All Ordinaries in Australian Markets
Before 1980, investors relied on fragmented state-based indices that failed to capture national market trends. The All Ordinaries emerged to unify this view, immediately establishing a comprehensive national benchmark. School Terms SA 2025 – Official Dates and Holidays provides additional Australian scheduling information.
Today, the index functions as the broadest available Australian equity bellwether, encompassing everything from multinational mining giants to mid-cap industrials. While newer benchmarks dominate derivative trading due to liquidity constraints, the All Ordinaries retains significance as the definitive measure of total market movements, reflecting deeper economic shifts than narrower indices.
Authority and Management Sources
Index methodology and constituent data derive from official S&P Dow Jones Indices documentation maintained in partnership with the Australian Securities Exchange. These entities calculate rankings using aggregate market values (shares outstanding multiplied by current price) on a free-float basis.
The All Ordinaries Index is Australia’s oldest stock market index, established in January 1980 with a base value of 500, tracking the share prices of the 500 largest companies by market capitalization listed on the Australian Securities Exchange.
S&P Dow Jones Indices Methodology Documentation
The All Ordinaries at a Glance
The All Ordinaries Index provides the widest lens on Australian equity performance, spanning 500 market-cap-ranked companies since 1980. While the ASX 200 attracts more derivative trading activity, the All Ords remains essential for understanding total market movements, from historical crises to recent record highs. SAS Rogue Heroes – Cast, True Story and Season 2 Guide presents additional Australian historical content.
Frequently Asked Questions
Who manages the All Ordinaries Index?
S&P Dow Jones Indices manages the index in partnership with the Australian Securities Exchange, calculating rankings based on free-float market capitalization.
What companies comprise the All Ordinaries Index?
The 500 largest ASX-listed companies ranked solely by market capitalization, covering approximately 95 percent of total ASX market value.
What distinguishes XAO from XAOA?
XAO tracks price levels only, while XAOA represents the Total Return Index including reinvested dividends for comprehensive performance measurement.
Why did the ASX 200 supersede the All Ordinaries for trading products?
The April 2000 ASX 200 launch focused on higher liquidity requirements, making it more suitable for derivatives and exchange-traded products than the broader All Ords.
How frequently do All Ordinaries constituents change?
Changes occur when market capitalizations shift ranking positions; no fixed rebalancing schedule is publicly specified in available methodology documents.
What market coverage does the index provide?
The All Ordinaries represents approximately 95 percent of total ASX market capitalization, expanded from 87 percent at its 1980 inception.
More related posts
 Leonardo da Vinci: Life, Masterpieces, and Unsolved Mysteries
 Lois Boisson: French Open Semifinal, Gender Rumors, Career Stats
 Adam Simpson: Hungry Jack’s Ownership & Coaching Future
 Zach LaVine: Career, Contract, Trade & Stats Guide
 Jimmy Carter Dies at 100: 39th President and Humanitarian
 Lyle Menendez: Hair Loss, Parole Denied, and Life Behind Bars
 Barbara Palvin: Bio, Net Worth, Diagnosis, and Relationships
 Kerry Packer: Media Empire, Cricket & High-Stakes Gambling